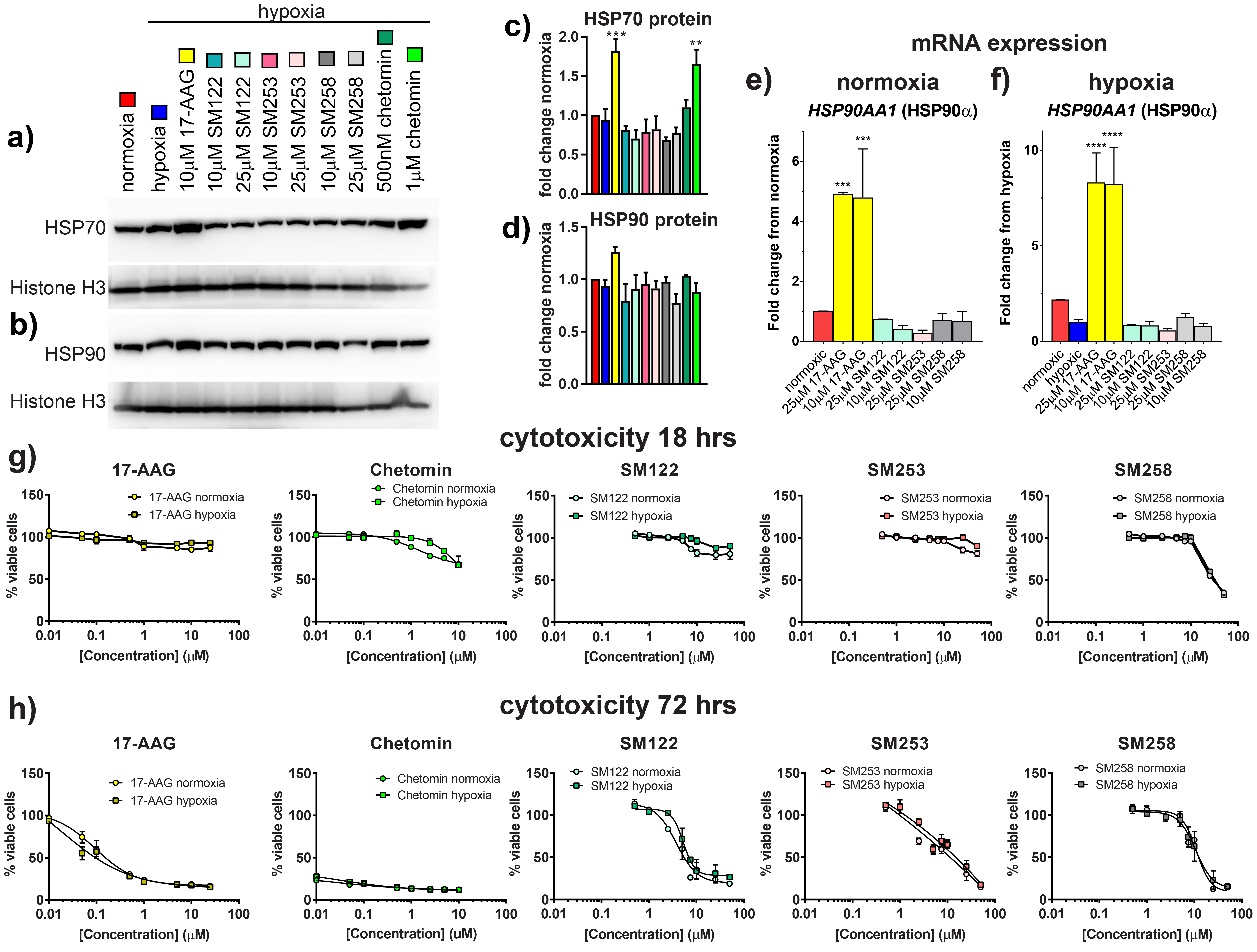
Fig. 2. The N-terminal HSP90 inhibitor 17-AAG increases the heat shock response, while C-terminal SM compounds do not. HCT116 cells were incubated ± SM compounds, 17-AAG or chetomin in normoxia or hypoxia for 18 hrs (a-g) or 72 hrs (h) to measure the heat shock response and cytotoxicity. a) Representative blot shown for HSP70 (a) or HSP90 (b) induction in hypoxia by HSP90 inhibitors. Densitometry graphs of western blots are normalized to normoxia and shown for HSP70 (c) (n=3) and HSP90 (d) (n=4). e) mRNA HSP90AA1 expression by HSP90 inhibitors in normoxia. f) mRNA HSP90AA1 induction by HSP90 inhibitors in hypoxia (n ≥ 3, run in duplicate for (e) and (f)). mRNA data normalized to 18s RNA. Data analyzed using an ordinary one-way ANOVA with multiple comparisons to normoxia (e) or hypoxia (f) in Graphpad Prism. Statistically significant results are indicated as follows: ** = p <0.01 vs normoxia, *** = p <0.001 vs normoxia, and **** = p <0.0001 vs normoxia. g) Cytotoxicity of HSP90 inhibitors and chetomin was measured using Celltiter Blue Assay following 18hrs (g) or 72 hrs (h) of drug treatment (n ≥ 3, run in duplicate). DMSO controls are equal to 100% in each graph. Data was fit using non-linear regression in GraphPad Prism (Sigmoidal, 4PL, x is log(concentration)).